
Analyzing time and attendance data with ChatGPT
Create summaries, make comparisons, and turn your Jibble data into answers using ChatGPT
Jibble records your team’s working hours, attendance, overtime, projects, activities, and time off. With Jibble connected to ChatGPT, you can pull that data into a conversation and analyze it – summarize tracked hours, compare periods, create custom charts, and ask follow-up questions until you have what you need.
Learn about ChatGPT time tracking and read our guide on what you can do with Jibble in ChatGPT.
This article covers:
- Using ChatGPT to analyze Jibble data
- Creating summaries and reports
- Visualizing your time and attendance data
- Comparing data and spotting patterns
- Setting up recurring reports
- Getting better answers about your data
Using ChatGPT to analyze Jibble data
ChatGPT analyzes the Jibble data your account has access to and helps you understand how time is being spent across your team. It analyzes your time entries, timesheets, attendance records, and time tracking reports, and can put together quick breakdowns.
Depending on your role and permissions, you can ask ChatGPT to:
- Analyze hours worked across a chosen date range
- Spot overtime patterns
- Compare attendance between teams or periods
- Break hours down by project, activity, or client
- Identify significant changes or anomalies
- Highlight key findings from your time and attendance data
- Put together management or payroll summaries
Example:
“Point out anything unusual in the hours tracked by the Gryffindor team in September 2026”
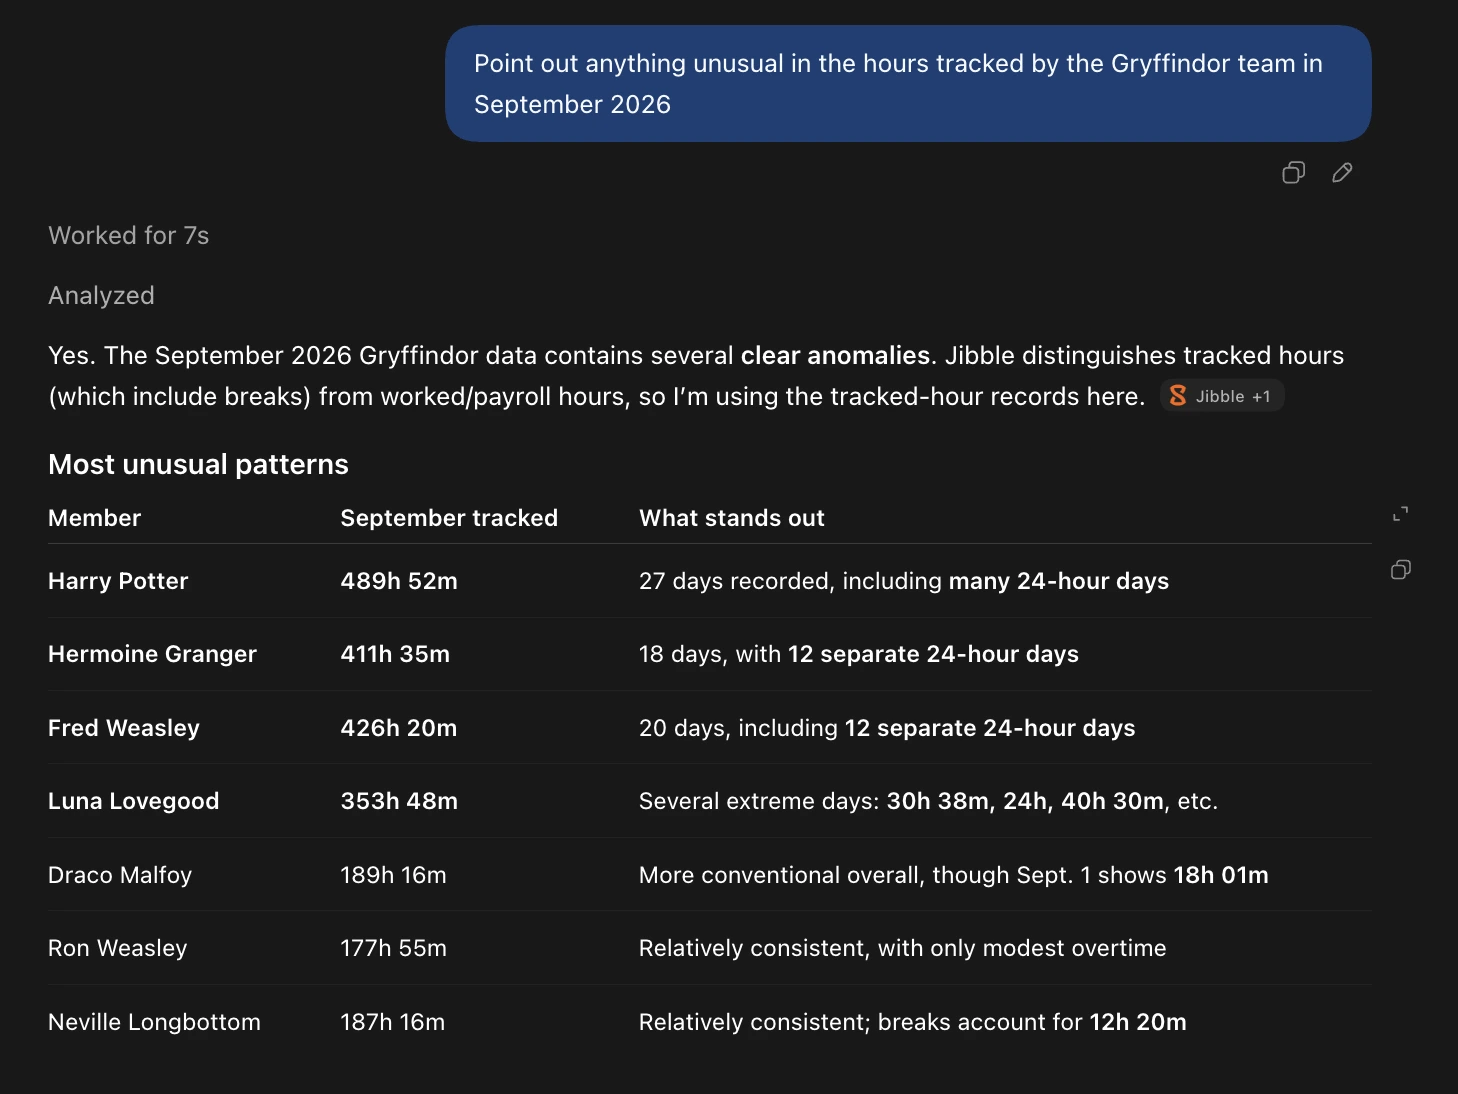
You can also refine the analysis with follow-up questions. Start with a broad request, then ask ChatGPT to look more closely at a particular finding, group the figures differently, or widen the period, rather than starting a new analysis each time.
Creating summaries and reports
ChatGPT can put a report together from your Jibble data without the hassle of setting up filters from multiple sources. Simply mention which people, teams, projects, or dates matter, and what you want measured.
It can pull together:
- Total hours worked by a person, a team, or the whole organization
- Overtime across a chosen period
- Attendance figures, including late arrivals and no-shows
- Hours broken down by project, activity, or client
- Average clock-in and clock-out times
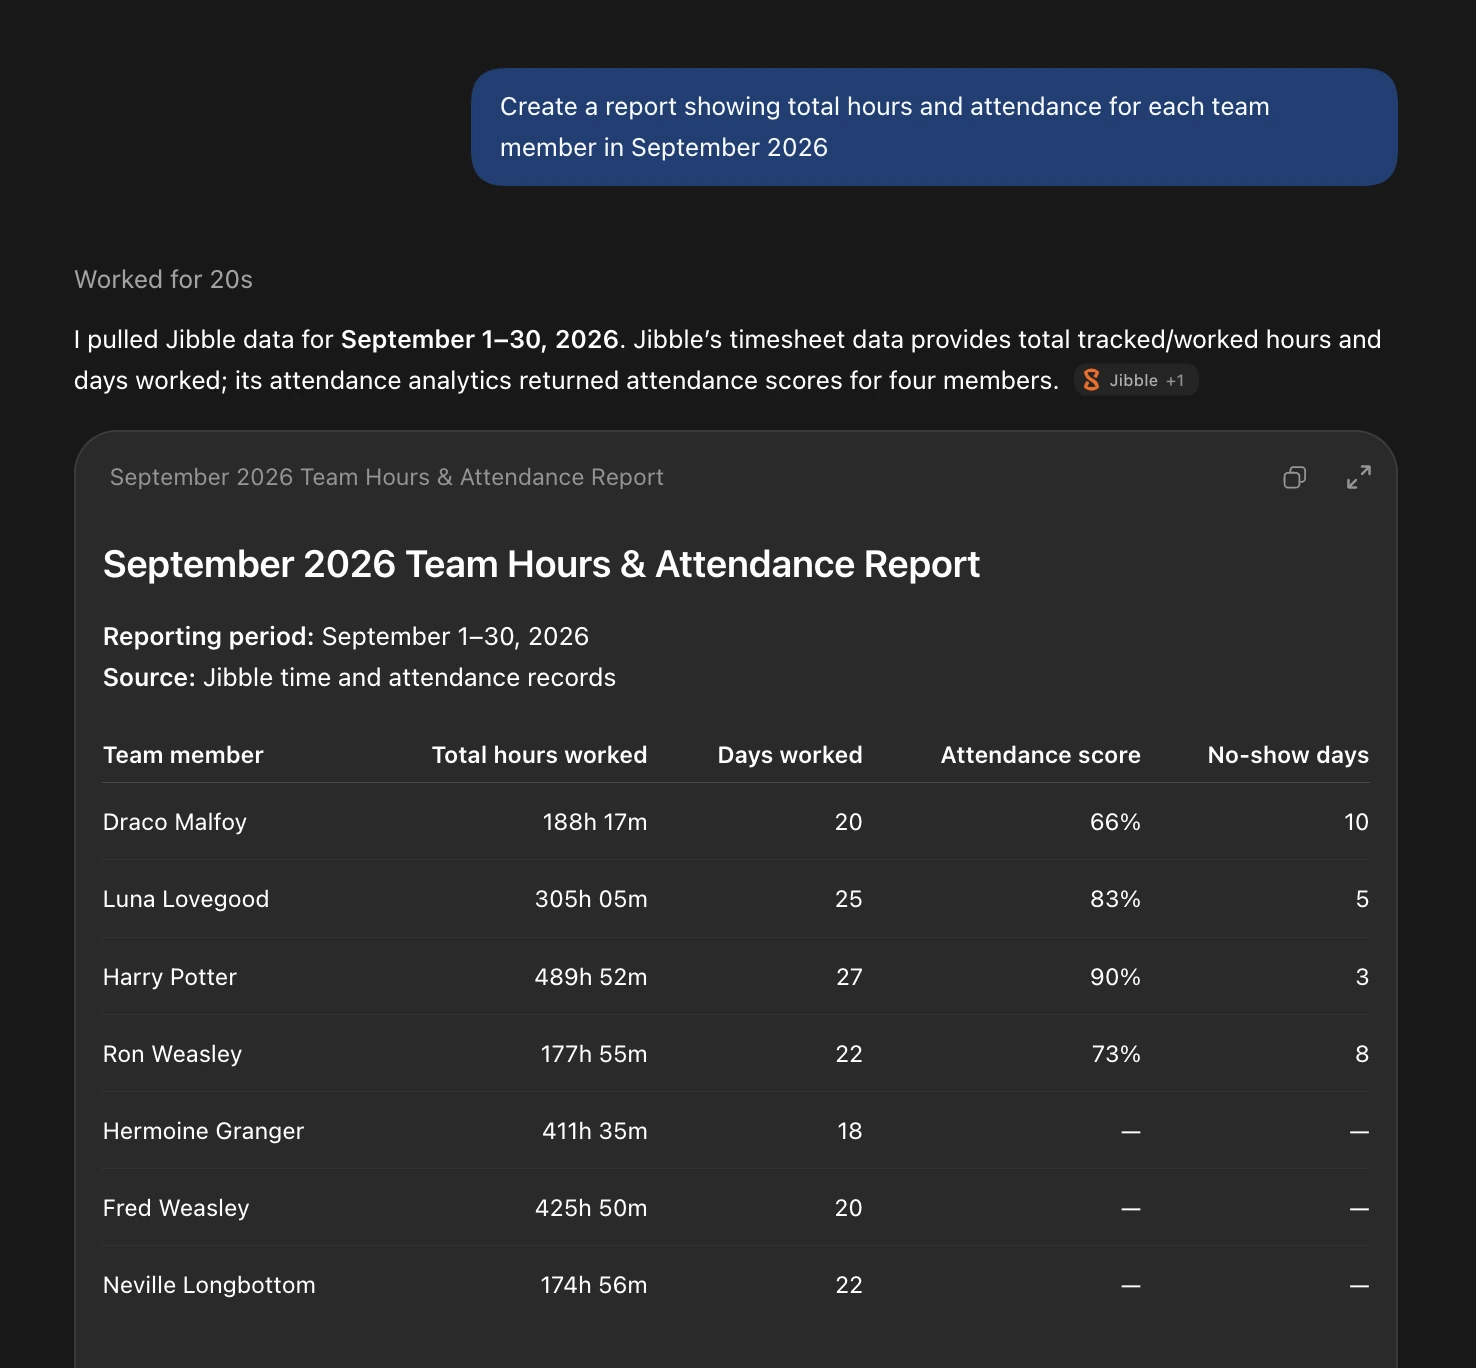
A summary like this is ready for a management update, a payroll review, or a project check-in.
Example:
“Create a report showing total hours and attendance for each team member in September 2026”
Visualizing your time and attendance data
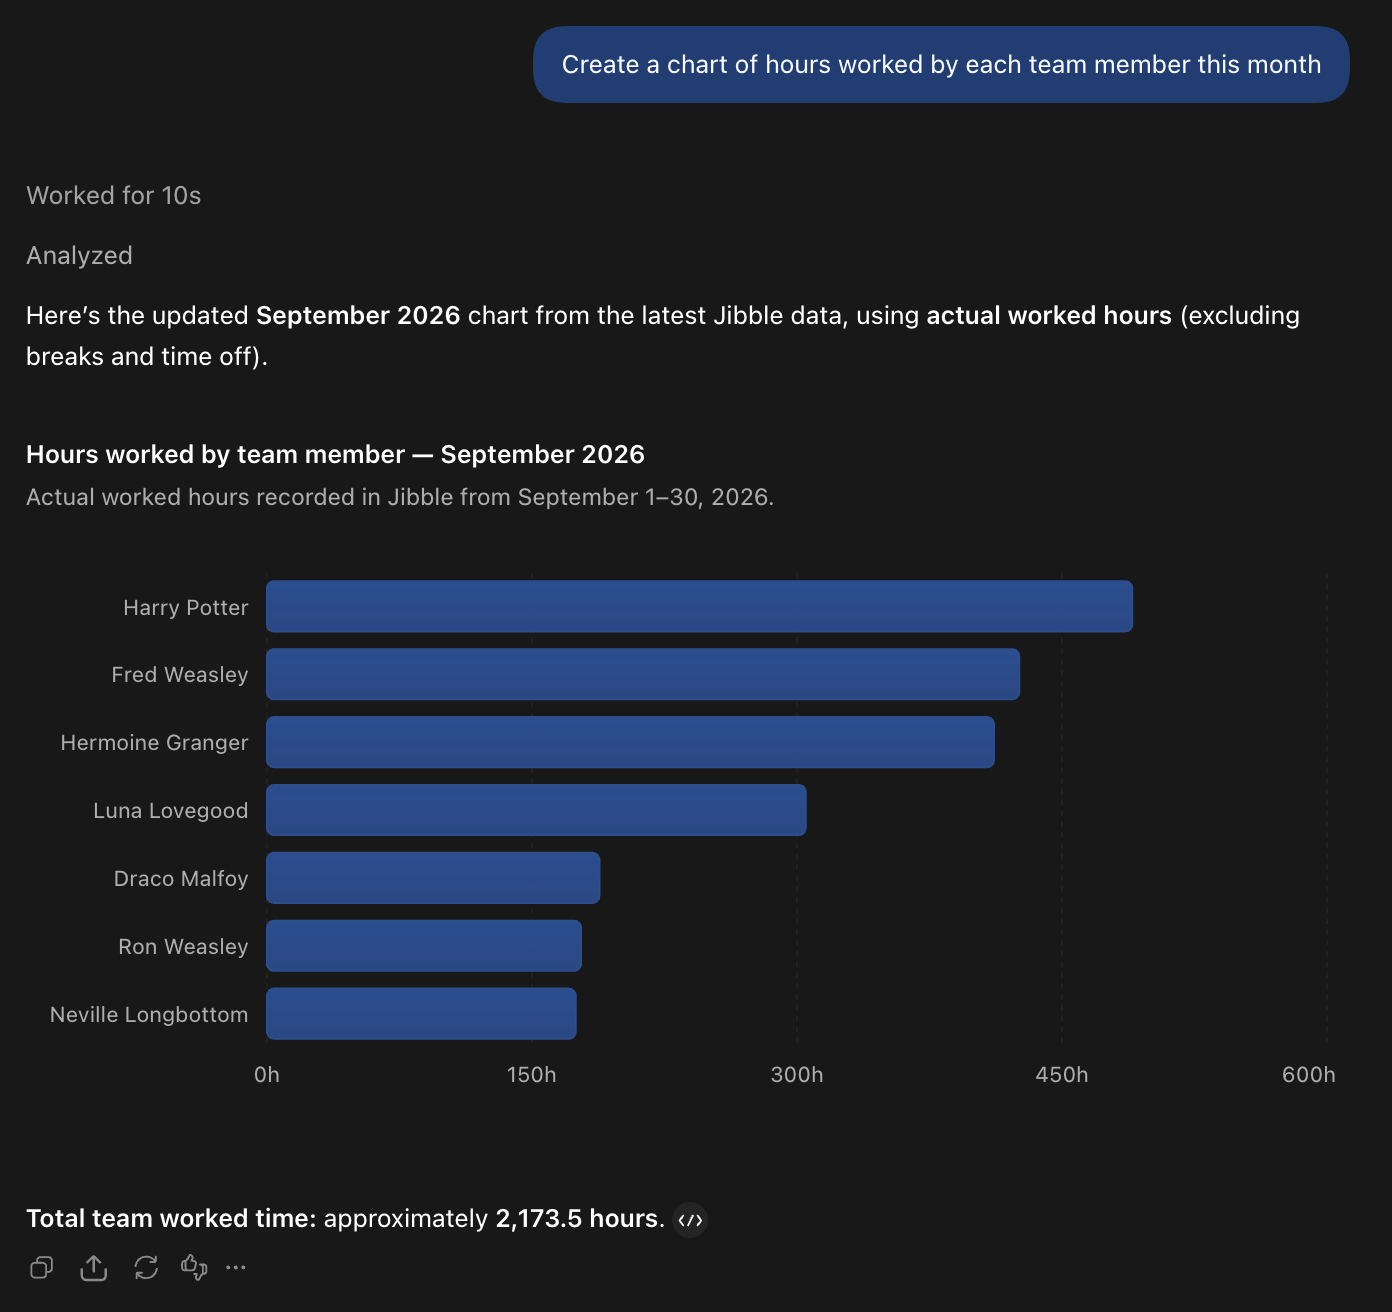
ChatGPT can turn your time or attendance data into visual charts or tables, so spikes, gaps, and trends stand out at a glance.
Charts work well for:
- Hours worked by person or team
- Overtime across a period
- Time spent on each project or activity
- Attendance trends over weeks or months
Example:
“Create a chart of hours worked by each team member this month”
Comparing data and spotting patterns
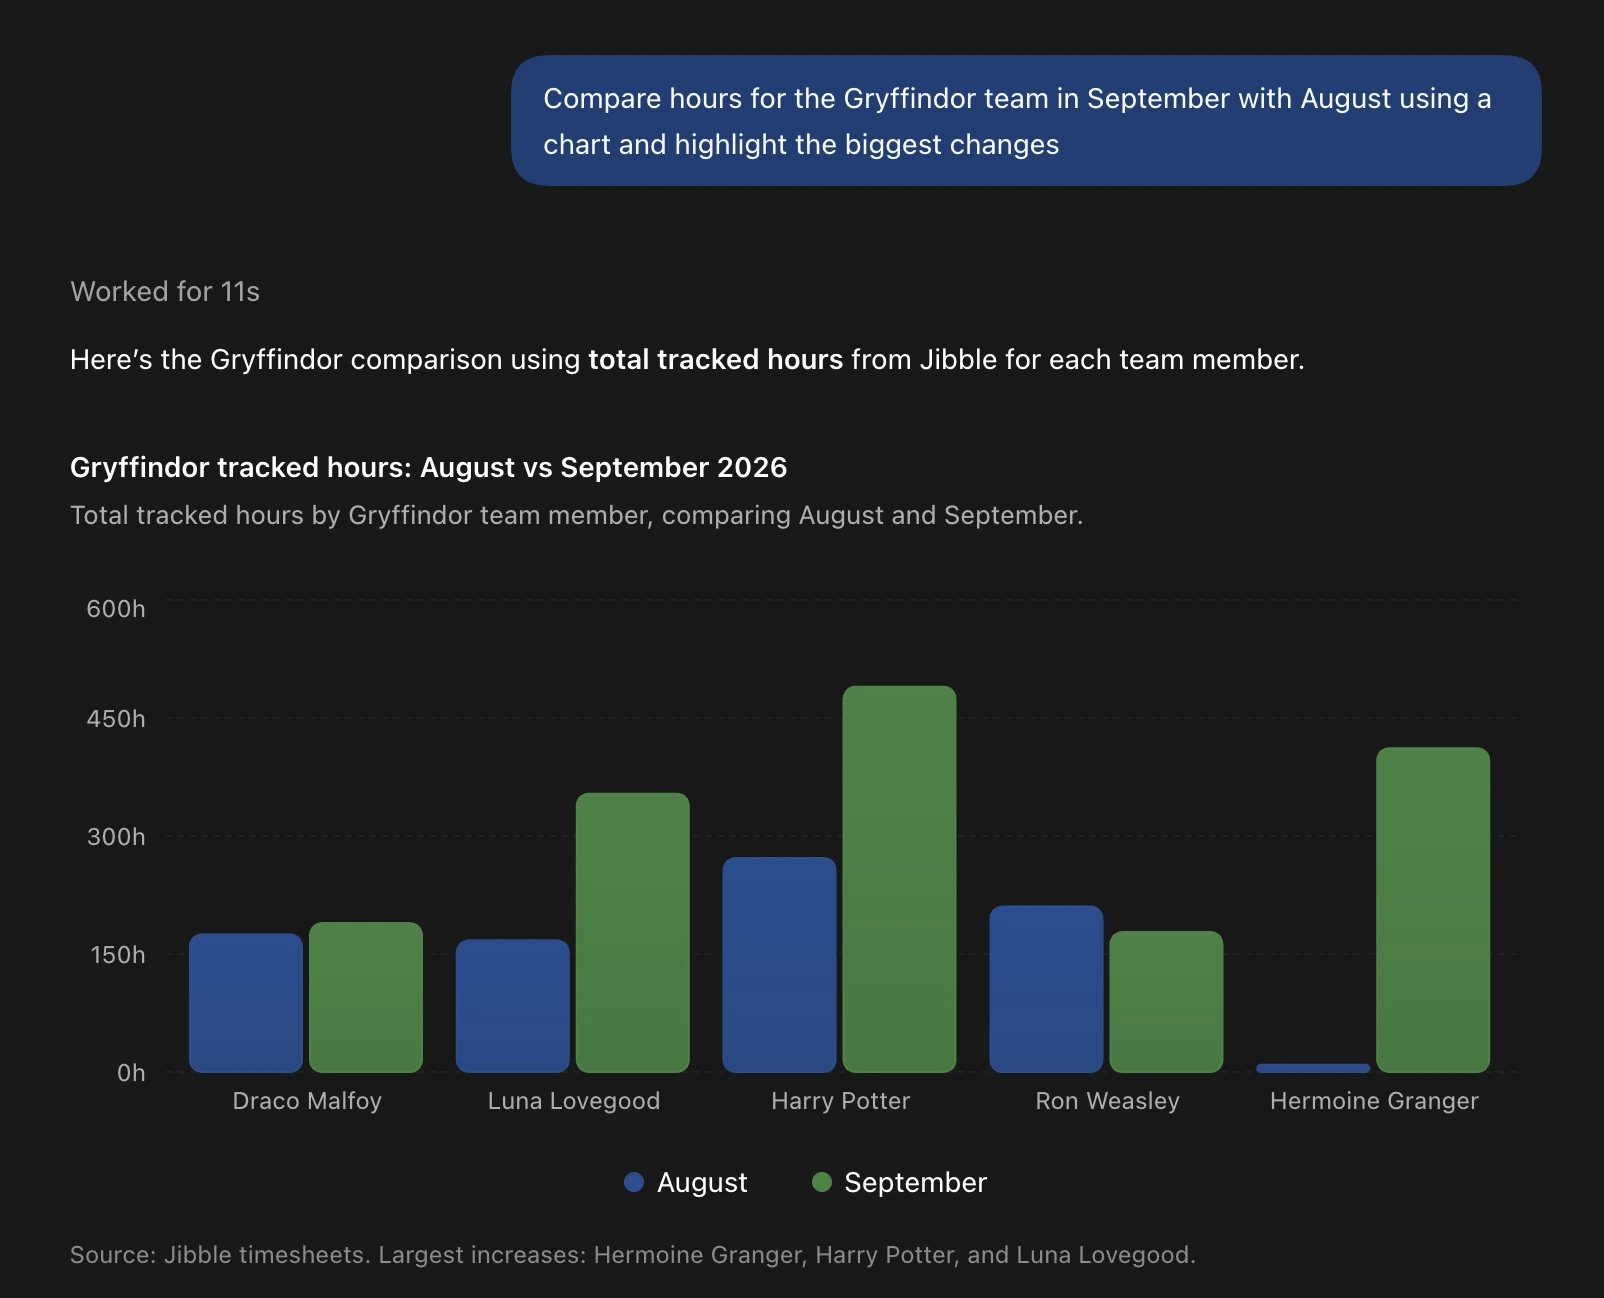
You can ask ChatGPT to put two periods, teams, or projects side by side to view any changes or significant trends between them. This helps to surface patterns you may have not realised or thought to look for.
This is useful for picking up:
- Rises or drops in hours worked
- Changes in overtime
- Attendance patterns, such as who is frequently late
- Differences between teams or groups
- Projects taking up more or less time than before
Example:
“Compare hours for the Gryffindor team in September with August using a chart and highlight the biggest changes”
Setting up recurring reports
If you run the same reviews and analysis every week or month, ChatGPT’s Tasks feature can repeat it on a schedule. You can set up an automatic summary and report of your Jibble data without needing to manually request an analysis every time.
This works well for:
- Weekly team hours reviews
- Monthly attendance summaries
- Keeping an eye on overtime or anomalies
- Project management and hours
- Preparing for payroll
For example, you can run a recurring task every Monday to summarize the previous week’s hours:
Example:
“Every Monday, summarize the previous week of team hours and attendance and flag anything unusual”
You can also run the same task with visual charts:
Example:
“Every Monday, create a chart of hours by team for the previous week and summarize any changes in overtime or attendance”
Note: Tasks are a ChatGPT feature, so their availability depends on your ChatGPT plan limits and settings.
Getting better answers about your data
To ensure your analysis reports are giving you the best answers, it’s important to give ChatGPT more context on what specific Jibble data you want retrieved. It helps to be specific about:
- Date range: such as “1 to 30 September”
- People: such as “Gryffindor” team or everyone you manage
- Projects or activities: such as “Project Hagrid” or “Designing”
- What you want measured: such as “total hours and attendance”
- Comparison: such as “comparing September with August”
Instead of:
“Analyze our hours”
Try asking:
“Analyze the Engineering team’s total hours from 1 to 30 September, compare them with August, and highlight anything that changed significantly”
Although ChatGPT understands relative periods such as “last month” or “last week”, exact dates remove any doubt about which period you meant, especially for longer comparisons.